
Do you need an LLC for ATM business? This question is crucial for anyone considering entering the ATM industry. The legal structure you choose significantly impacts your liability, tax obligations, and overall business success. Understanding the differences between sole proprietorships, partnerships, LLCs, and corporations is paramount before investing in ATM machines and navigating the complexities of regulatory compliance and risk management. This guide will clarify the advantages and disadvantages of each legal structure, helping you make an informed decision tailored to your specific circumstances.
We’ll delve into the potential risks and liabilities inherent in ATM operations, such as theft, vandalism, and equipment malfunctions. We’ll also explore effective risk mitigation strategies, including insurance options and robust security measures. Crucially, we will examine the protective shield an LLC provides against personal liability for business debts and legal issues. Finally, we’ll cover the financial aspects of running an ATM business as an LLC, including tax implications and best practices for financial management. By the end, you’ll have a clear understanding of whether an LLC is the right choice for your ATM venture.
Legal Structures for ATM Businesses
Choosing the right legal structure for your ATM business is crucial for managing liability, taxes, and administrative burdens. The structure you select will significantly impact your financial responsibilities and operational complexities. Understanding the differences between sole proprietorships, partnerships, LLCs, and corporations is essential for making an informed decision.
Sole Proprietorship
A sole proprietorship is the simplest structure, where the business is owned and run by one person, and there’s no legal distinction between the owner and the business. This means the owner directly receives all profits but also bears complete personal liability for business debts and lawsuits. Taxation is straightforward, with profits reported on the owner’s personal income tax return. Administrative burdens are minimal, requiring less paperwork than other structures. However, the unlimited liability is a significant drawback. For example, if a customer sues due to an ATM malfunction and wins a judgment, the owner’s personal assets are at risk.
Partnership
A partnership involves two or more individuals who agree to share in the profits or losses of a business. Like sole proprietorships, partners typically face unlimited personal liability. There are several types of partnerships (general, limited, etc.), each with varying degrees of liability and management control. Taxation is similar to sole proprietorships, with profits and losses passed through to the partners’ individual tax returns. Administrative burdens increase compared to a sole proprietorship, requiring a partnership agreement outlining responsibilities and profit-sharing arrangements. A significant risk is the potential for disagreements between partners, impacting the business’s operational efficiency.
Limited Liability Company (LLC)
An LLC offers the advantage of limited liability, separating the owner’s personal assets from business debts and lawsuits. This means that if the business incurs debt or faces a lawsuit, the owner’s personal assets are generally protected. Taxation is flexible, with many LLCs choosing to be taxed as pass-through entities (like sole proprietorships and partnerships), while others opt for corporate taxation. Administrative burdens are generally higher than sole proprietorships but lower than corporations, requiring the filing of articles of organization and annual reports. The setup costs are typically higher than a sole proprietorship but offer significant liability protection.
Corporation (S Corp or C Corp)
Corporations, either S corporations or C corporations, offer the strongest liability protection, completely separating the business from its owners. However, they are the most complex to establish and maintain, involving significant administrative burdens, including regular filings and corporate governance requirements. Taxation is more complex, with corporations subject to corporate income tax, and shareholders paying taxes on dividends. C corporations face double taxation (corporate and shareholder levels), while S corporations avoid this double taxation. Setup costs are considerably higher than other structures, encompassing legal fees, filing fees, and ongoing compliance expenses. The higher complexity and costs are often balanced by the enhanced liability protection and potential for attracting investors.
Comparison of Legal Structures for ATM Businesses
| Legal Structure | Liability Protection | Tax Implications | Setup Costs |
|---|---|---|---|
| Sole Proprietorship | Unlimited liability | Pass-through taxation | Low |
| Partnership | Generally unlimited liability (varies by type) | Pass-through taxation | Low to Moderate |
| LLC | Limited liability | Pass-through or corporate taxation (depending on election) | Moderate |
| Corporation (S Corp or C Corp) | Limited liability | Corporate taxation (C Corp) or Pass-through taxation (S Corp) | High |
Liability and Risk Management in ATM Operations: Do You Need An Llc For Atm Business

Operating an ATM business presents a unique set of risks and liabilities that require careful consideration and proactive mitigation strategies. Failure to adequately address these risks can lead to significant financial losses, legal battles, and reputational damage. Understanding these potential issues and implementing robust risk management plans is crucial for the long-term success and stability of any ATM business.
Potential Risks and Liabilities in ATM Operations
ATM businesses face a range of potential liabilities, stemming from both operational malfunctions and external factors. These risks span financial losses, physical damage, and legal repercussions. A comprehensive understanding of these potential liabilities is the first step towards effective risk management. For example, malfunctioning ATMs can lead to customer frustration and potential financial losses due to failed transactions or disputes. Criminals may target ATMs for theft or vandalism, resulting in property damage and potential loss of cash. Furthermore, regulatory non-compliance can result in substantial fines and legal penalties. Finally, security breaches involving customer data can lead to significant financial and reputational damage.
Mitigation Strategies for ATM Risks
Effective risk mitigation involves a multi-pronged approach combining robust security measures, comprehensive insurance coverage, and adherence to regulatory compliance. This integrated strategy aims to minimize the likelihood and impact of potential incidents. Security measures should include robust physical security (e.g., surveillance cameras, tamper-proof casings, secure locations), regular maintenance and servicing of ATMs to prevent malfunctions, and strong cybersecurity protocols to protect against data breaches. Regular cash replenishment schedules can also minimize the amount of cash on hand at any given time, reducing the attractiveness of the ATM as a target for theft.
The Role of an LLC in Protecting Personal Assets
Forming a Limited Liability Company (LLC) offers significant protection against business liabilities. An LLC provides a legal separation between the business’s assets and the personal assets of the owner(s). This means that in the event of a lawsuit or financial difficulty related to the ATM business, personal assets such as homes, savings, and vehicles are generally protected from seizure. This crucial separation of liability is a key benefit of choosing an LLC structure for an ATM business, shielding personal wealth from the risks inherent in the operation.
Relevant Insurance Policies for ATM Businesses
Several insurance policies are crucial for mitigating financial losses associated with various risks. Commercial general liability insurance covers bodily injury or property damage caused by the ATM or its operation. Crime insurance can cover losses due to theft or robbery of cash from the ATM. Equipment breakdown insurance protects against financial losses from ATM malfunctions or damage. Cyber liability insurance is essential to cover losses resulting from data breaches or cyberattacks. Finally, professional liability insurance, also known as errors and omissions insurance, can protect against claims arising from errors or omissions in the business’s operations. The specific coverage amounts and policy details should be tailored to the individual needs and risk profile of the ATM business.
Regulatory Compliance for ATM Businesses
Operating an ATM business requires navigating a complex web of federal and state regulations designed to protect consumers and ensure fair practices. Failure to comply can result in significant fines, legal action, and reputational damage. This section Artikels key regulatory considerations for ATM operators.
Federal Regulations Governing ATM Operations
Federal regulations primarily focus on consumer protection, security, and accessibility. The key federal agency involved is the Consumer Financial Protection Bureau (CFPB), which enforces regulations related to fee disclosures, error resolution, and accessibility standards. The Federal Deposit Insurance Corporation (FDIC) also plays a role, particularly for ATMs associated with insured financial institutions.
- Electronic Fund Transfer Act (EFTA) and Regulation E: This act and its implementing regulation govern electronic fund transfers, including ATM transactions. Key aspects include clear and conspicuous fee disclosures, timely error resolution procedures, and liability limitations for consumers in case of unauthorized transactions. Operators must adhere strictly to these rules to avoid penalties.
- Americans with Disabilities Act (ADA): The ADA mandates accessibility for individuals with disabilities. This includes ensuring ATMs are compliant with accessibility guidelines, such as providing accessible card readers, keypads, and receipt dispensers for wheelchair users and visually impaired individuals. Failure to comply can result in significant fines.
- Bank Secrecy Act (BSA) and Anti-Money Laundering (AML) Regulations: These regulations require ATM operators to implement measures to prevent money laundering and other financial crimes. This involves maintaining transaction records, implementing customer identification procedures (KYC), and reporting suspicious activities to the Financial Crimes Enforcement Network (FinCEN).
State Regulations Governing ATM Operations
State regulations vary considerably, covering licensing, permitting, fees, and specific operational requirements. Many states require licenses or permits to operate ATMs, often involving background checks and financial solvency requirements. Some states have specific regulations regarding fee disclosures, placement restrictions, and maintenance standards. It is crucial to research the specific regulations of each state where ATMs are deployed.
- Licensing and Permitting: States such as California, New York, and Florida, among others, have specific licensing or permitting requirements for ATM operators. These often involve applications, fees, and background checks. The specific requirements vary greatly by state.
- Fee Disclosures: While the EFTA sets minimum requirements for fee disclosures, some states may have more stringent regulations regarding the placement, size, and clarity of fee information displayed on ATMs.
- Placement Restrictions: Certain states may restrict the placement of ATMs in specific locations, such as near schools or hospitals, or may require specific approvals before installing an ATM in a particular area.
- Maintenance and Security: Many states have regulations regarding the maintenance and security of ATMs, including requirements for regular servicing, security cameras, and emergency contact information.
Compliance with Consumer Protection Laws Related to ATM Transactions
Compliance with consumer protection laws is paramount for ATM operators. This involves ensuring accurate and conspicuous fee disclosures, implementing robust error resolution procedures, and adhering to accessibility standards. Failure to comply can lead to significant fines and legal repercussions.
- Fee Transparency: Operators must clearly and conspicuously disclose all fees associated with ATM transactions before the transaction is completed. This includes surcharges, network fees, and any other charges.
- Error Resolution: Operators must have a clear and efficient process for resolving errors related to ATM transactions, such as incorrect withdrawals or declined transactions. This often involves providing consumers with a method to dispute the transaction and receive a refund if warranted.
- Accessibility Compliance: ATMs must be accessible to individuals with disabilities, complying with ADA standards. This includes features such as audio prompts, braille keypads, and accessible card readers.
Financial Aspects of ATM Businesses and LLCs
Operating an ATM business involves careful consideration of financial factors, and choosing the right legal structure, such as an LLC, significantly impacts these aspects. Understanding the financial benefits and drawbacks of an LLC, along with effective financial management strategies, is crucial for profitability and long-term success.
Financial Benefits and Drawbacks of an LLC for ATM Businesses
The limited liability company (LLC) structure offers several financial advantages for ATM businesses. Primarily, it provides liability protection, shielding personal assets from business debts and lawsuits. This is especially important in the ATM industry, where potential liabilities include equipment malfunction, theft, or disputes with customers. However, LLCs can also present some financial drawbacks. The formation and maintenance of an LLC typically involve ongoing fees and administrative costs. Furthermore, depending on the state and the LLC’s structure, tax implications can vary, potentially leading to higher overall tax burdens compared to sole proprietorships in certain circumstances. Careful consideration of these factors is necessary to determine if the benefits outweigh the costs for a specific ATM business.
Tax Implications for LLCs Compared to Other Business Structures
The tax implications for an LLC are flexible and depend on the chosen tax classification. An LLC can be taxed as a sole proprietorship, partnership, S corporation, or C corporation. This choice significantly impacts the owner’s tax liability. For example, an LLC taxed as a sole proprietorship or partnership reports profits and losses on the owner’s personal income tax return, while an LLC taxed as an S corporation or C corporation files a separate tax return. In comparison, a sole proprietorship or partnership typically has simpler tax filings, but the owner is personally liable for all business debts. A corporation, while offering liability protection, often faces higher tax rates and more complex compliance requirements. The optimal tax structure for an ATM business depends on factors like profit levels, owner’s tax bracket, and long-term business goals. Consulting with a tax professional is highly recommended to determine the most advantageous structure.
A Simple Financial Model for an ATM Business
A simplified financial model can help illustrate the potential profitability of an ATM business. Let’s assume an ATM generates an average of $100 per day in transaction fees, operating 365 days a year. This generates a gross revenue of $36,500 annually. Expenses include ATM rental or purchase costs (let’s assume $500 per month or $6,000 annually), maintenance and repair costs (approximately $1,000 annually), cash replenishment fees (estimated at $2,000 annually), and merchant fees (variable, let’s assume 1% of revenue or $365). Total annual expenses are therefore $9,365. Subtracting expenses from gross revenue yields a net profit of $27,135. This is a simplified model; actual profitability will vary based on location, transaction volume, fees charged, and operational costs. This example demonstrates that even a single ATM can be potentially profitable, but a thorough market analysis and realistic financial projections are essential before launching the business.
Best Practices for Managing the Finances of an ATM Business
Effective financial management is critical for the success of any ATM business. This includes implementing a robust budgeting system, regularly tracking expenses, and maintaining accurate financial records. A detailed budget should forecast all revenue streams and expenses, allowing for proactive adjustments to maintain profitability. Regular expense tracking, ideally using accounting software, helps identify areas for cost reduction and optimize operational efficiency. Reconciling bank statements and credit card transactions with internal records ensures accuracy and helps detect potential discrepancies. Maintaining detailed records of all transactions is not only crucial for tax purposes but also assists in identifying trends, managing cash flow, and making informed business decisions. Regular review of financial statements, including profit and loss statements and balance sheets, is essential to monitor performance and make necessary adjustments to the business strategy.
ATM Business Setup and Operations
Establishing a successful ATM business requires careful planning and execution across several key areas. From securing the right location and acquiring reliable equipment to establishing processing agreements and managing daily operations, each step contributes to the overall profitability and sustainability of the venture. This section details the crucial steps involved in setting up and operating an ATM business.
Location Selection
Choosing the optimal location is paramount for ATM profitability. High foot traffic areas, such as shopping malls, grocery stores, convenience stores, and busy commercial districts, generally yield higher transaction volumes. Factors to consider include accessibility, security, visibility, and proximity to competitors. A thorough market analysis, including competitor mapping and demographic studies, can inform location decisions. Negotiating favorable lease terms with property owners is also crucial, considering factors like rent, utilities, and security provisions. For example, a location near a university campus may attract a large student population, generating consistent transaction volume, whereas a location in a sparsely populated area may struggle to generate sufficient revenue to offset operational costs.
Equipment Acquisition and Installation
The ATM itself represents a significant investment. Options range from purchasing new machines outright to leasing or renting equipment. Purchasing offers long-term ownership but requires a substantial upfront capital outlay. Leasing provides flexibility but incurs ongoing rental fees. Regardless of the chosen model, careful consideration should be given to the ATM’s features, security capabilities, and reliability. This includes selecting a model with features like EMV card acceptance, robust security measures (such as anti-skimming devices), and reliable cash dispensing mechanisms. The installation process necessitates coordinating with the chosen equipment provider and the property owner to ensure seamless integration into the chosen location. It’s vital to comply with all local building codes and safety regulations during installation.
Processing Agreements
ATM processing agreements are contracts with payment processors that handle transaction processing, funds settlement, and merchant services. These agreements stipulate fees, transaction processing times, and other crucial terms. It’s essential to carefully review and understand the terms of the agreement before signing. Factors such as interchange fees, transaction fees, and settlement times should be compared across multiple processors to find the most cost-effective option. Negotiating favorable terms with the processor is crucial for maximizing profitability. For example, a higher volume of transactions might allow for negotiating lower per-transaction fees.
ATM Business Launch Checklist
Before launching the ATM business, a comprehensive checklist should be completed. This ensures all necessary permits, licenses, and agreements are in place.
- Secure all necessary licenses and permits.
- Establish a business bank account.
- Obtain insurance coverage (liability, property).
- Negotiate and finalize processing agreements.
- Complete ATM equipment acquisition and installation.
- Develop a cash management plan.
- Establish customer support channels.
- Implement security measures (surveillance, alarm systems).
Ongoing Operational Requirements
Maintaining a smoothly functioning ATM business requires consistent attention to several operational aspects.
Maintenance and Repairs
Regular maintenance is crucial for minimizing downtime and ensuring the ATM’s reliable operation. This includes scheduled servicing, software updates, and prompt repairs when necessary. A service contract with the equipment provider can ensure timely maintenance and reduce unexpected repair costs. Regular checks for potential security vulnerabilities, such as skimming devices, are also vital.
Cash Replenishment, Do you need an llc for atm business
Maintaining sufficient cash levels is critical to avoid ATM outages. A well-defined cash replenishment schedule, aligned with transaction volume patterns, should be implemented. This might involve using armored car services or employing trained personnel for cash handling. Procedures for secure cash handling and transportation are essential for minimizing risk.
Customer Support
Providing excellent customer support is key to maintaining customer satisfaction and loyalty. This might include offering readily available contact information, addressing customer inquiries promptly, and resolving any issues effectively. Consider providing a clear and concise set of instructions at the ATM, as well as contact information for support.
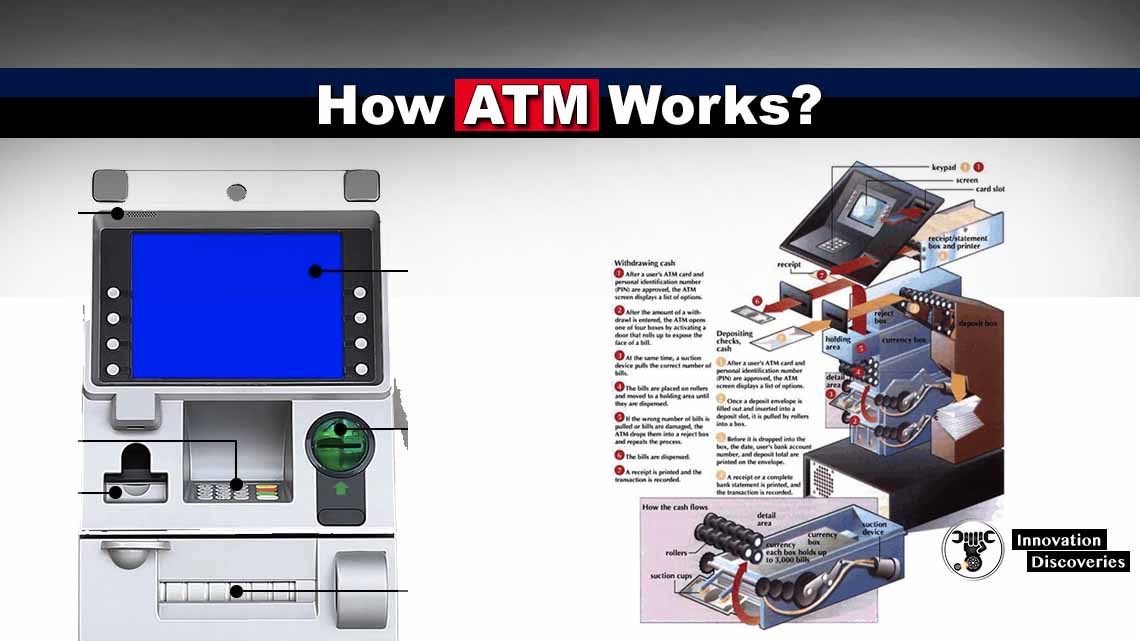
ATM Transaction Flowchart
The following flowchart illustrates the typical steps involved in an ATM transaction:
[Imagine a flowchart here. The flowchart would begin with the customer inserting their card. Next, it would show the authentication process (PIN entry). Then, it would depict the selection of a transaction type (withdrawal, deposit, balance inquiry). Following this would be the processing of the transaction by the ATM and the payment processor. Finally, the flowchart would conclude with the dispensing of cash (if applicable) and the update of the customer’s account balance. The flowchart would clearly show the flow of information and funds between the customer, the ATM, and the payment processor.]
Illustrative Examples of ATM Business Structures
Choosing the right legal structure for your ATM business is crucial for managing liability, taxes, and overall operational efficiency. The optimal structure depends heavily on the scale and complexity of your operations. A single-ATM owner will have vastly different needs than a company managing a network of ATMs across multiple states. The following examples illustrate how different legal structures can be applied to various ATM business scenarios.
Single-ATM Ownership: Sole Proprietorship
A sole proprietorship is the simplest structure, suitable for an individual operating a single ATM in a high-traffic location, perhaps within their own business. This structure directly links the owner’s personal assets with the business’s assets.
- Legal Structure: Sole Proprietorship. The business is not a separate legal entity from the owner.
- Rationale: Simplicity and ease of setup. Minimal paperwork and administrative overhead are involved.
- Liability: The owner is personally liable for all business debts and legal actions. A lawsuit against the business is a lawsuit against the owner personally.
- Equipment Failure: The owner bears the full financial burden of repairing or replacing the ATM.
Small ATM Network: Limited Liability Company (LLC)
An LLC offers increased liability protection compared to a sole proprietorship. This structure is appropriate for someone operating a small network of ATMs, perhaps across a single city or region.
- Legal Structure: Limited Liability Company (LLC). The business is a separate legal entity from the owner(s).
- Rationale: Provides limited liability protection, separating personal assets from business liabilities. Offers flexibility in taxation.
- Liability: Personal assets are generally protected from business debts and lawsuits. However, the level of protection can vary depending on state laws and the specific circumstances.
- Equipment Failure: The LLC’s assets are used to cover repair or replacement costs. The owner’s personal assets are generally protected.
Large-Scale ATM Deployment: Corporation (S-Corp or C-Corp)
For a large-scale ATM deployment across multiple states or even internationally, a corporation (either S-Corp or C-Corp) provides the most robust liability protection and allows for easier access to capital.
- Legal Structure: Corporation (S-Corp or C-Corp). The business is a separate legal entity, distinct from its shareholders.
- Rationale: Strong liability protection, easier access to capital through stock offerings, and established corporate governance structures.
- Liability: Shareholders’ personal assets are generally protected from business liabilities. However, directors and officers may still face personal liability in certain circumstances.
- Equipment Failure: The corporation’s assets are used to cover repair or replacement costs. Shareholders’ personal assets are typically protected.
Franchise Model: Partnership or LLC
If the ATM business operates under a franchise agreement, the most suitable structure might be a partnership (if two or more individuals are involved) or an LLC. The specific terms of the franchise agreement will influence the optimal choice.
- Legal Structure: Partnership or LLC. The specific structure will depend on the franchise agreement and the number of partners.
- Rationale: Provides a framework for managing the franchise relationship and distributing profits and losses.
- Liability: Liability will depend on the specific structure (partnership or LLC) and the terms of the franchise agreement. Partners in a general partnership face unlimited liability.
- Equipment Failure: The partnership or LLC assets would be used to cover the costs, potentially supplemented by the franchisor depending on the agreement.


